Methodology technical feasibility NbS 2
The objective of this map is to showcase which areas are suitable for flooded forest reforestation projects. Our methodology for analysing suitable areas for reforestation is based on two guiding principles:
-
The flooded forest has undergone severe deterioration and reforestation projects will therefore have a large impact.
-
The current biophysical conditions of an area should be suitable for flooded forest to thrive.
Approach
The spatial potential of the selected NbS types is mapped by overlaying different geospatial datasets, like hydrologic, soil, climatic data. This provides a first high-level indication to the effective geographic scalability of NbS. The suitability for a specific NbS is, where possible, classified in 4 classes: highly suitable, moderately suitable, marginally suitable and not suitable.
To assess the potential suitability for a specific NbS, several suitability factors we combined.

Each suitability factor dataset was scored using the following classification:
-
Score of 0: Not a suitable area given the specific suitability factor
-
Score of 1: Moderately suitable given the specific suitability factor
-
Score of 2: Highly suitable given the specific suitability factor
After classifying each individual suitability factor, an aggregated suitability score was calculated by summing up all the scores to yield a single aggregated total suitability score. The suitability class - highly, moderately or marginally suitable, thus depends on the aggregate suitability score of all factors.
Furthermore, should any of the factors render an area unsuitable (score 0), regardless of the scores from other factors, the area is automatically labelled as unsuitable.
Suitability components for flooded forest reforestation
To assess the potential suitability for flooded forest reforestation projects three suitability factors were combined.
Flooded forest landcover and forest integrity
Flooded forest or flooded forest-related land use classes severely distressed and with a low forest integrity score are suitable areas for forest reforestation programs.
Soil Type
The suitability of an area for flooded forest reforestation partly relies on optimal soil conditions for a flooded forest to thrive.
Months of inundation
The suitability of an area for flood forest reforestation partly relies on the optimal duration of yearly inundation of an area.
Flooded forest integrity score
The Forest Landscape Integrity Index integrates data on observed and inferred forest pressures and lost forest connectivity to generate a continuous index of forest integrity as determined by the degree of anthropogenic modification. The study brought together 47 forest experts worldwide to apply recent developments in cloud computing and large new datasets.
The Forest integrity score index was combined with flooded forest land cover to determine the integrity of flooded forests in Cambodia. The following classification system has been used:
-
Highly suitable: Flooded forest cover with a forest integrity score of less than 5, meaning that the flooded forest in that area has a high degree of anthropogenic modification.
-
Moderately suitable: Flooded forest cover with a forest integrity score between 5 and 8, meaning that the flooded forest in that area has a moderate degree of anthropogenic modification.
-
Not suitable: Flooded forest cover with a forest integrity score of above 8, meaning that the flooded forest in that area has a low degree of anthropogenic modification.
Soil type
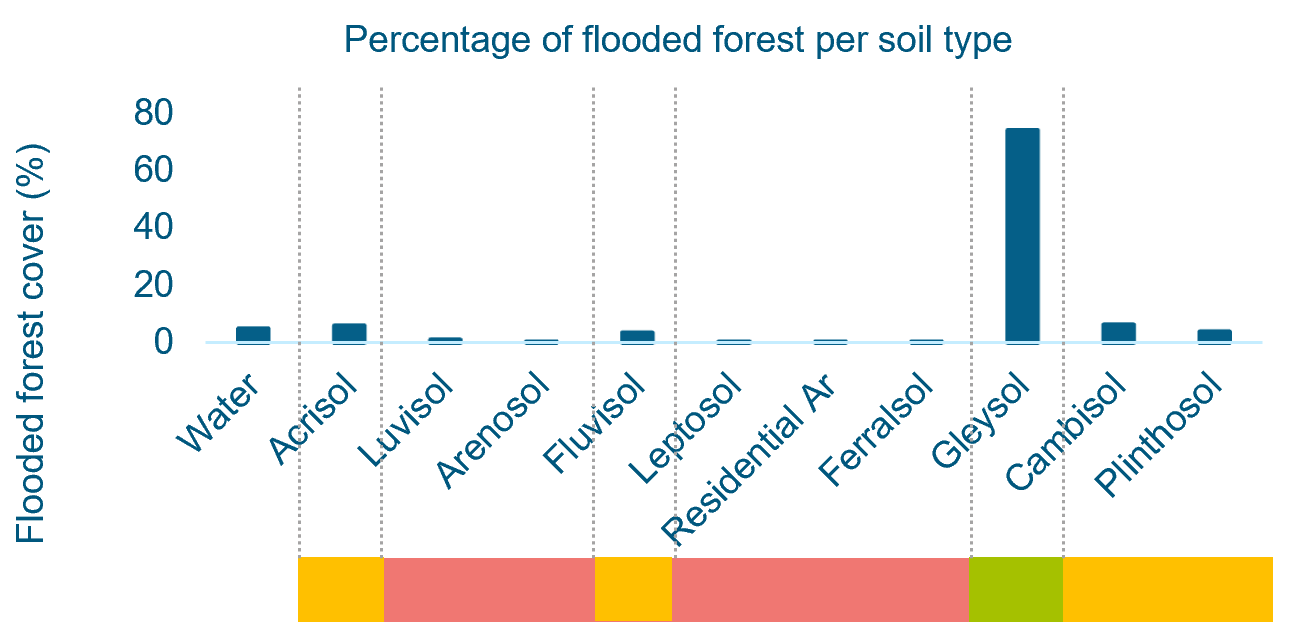
We combined the flooded forest land cover and a soil map to analyse in which soil conditions flooded forest thrives in Cambodia. The figure below presents the findings, illustrating the percentage of flooded forest coverage per soil type. This analysis has resulted in the following classification:
-
i [Green] - Highly suitable: Gleysol
-
ii [Orange] - Moderately suitable: Acrisol, Fluvisol, Cambisal, Plinthosol
-
iii [Red] - Not suitable : All others
Duration of yearly inundation
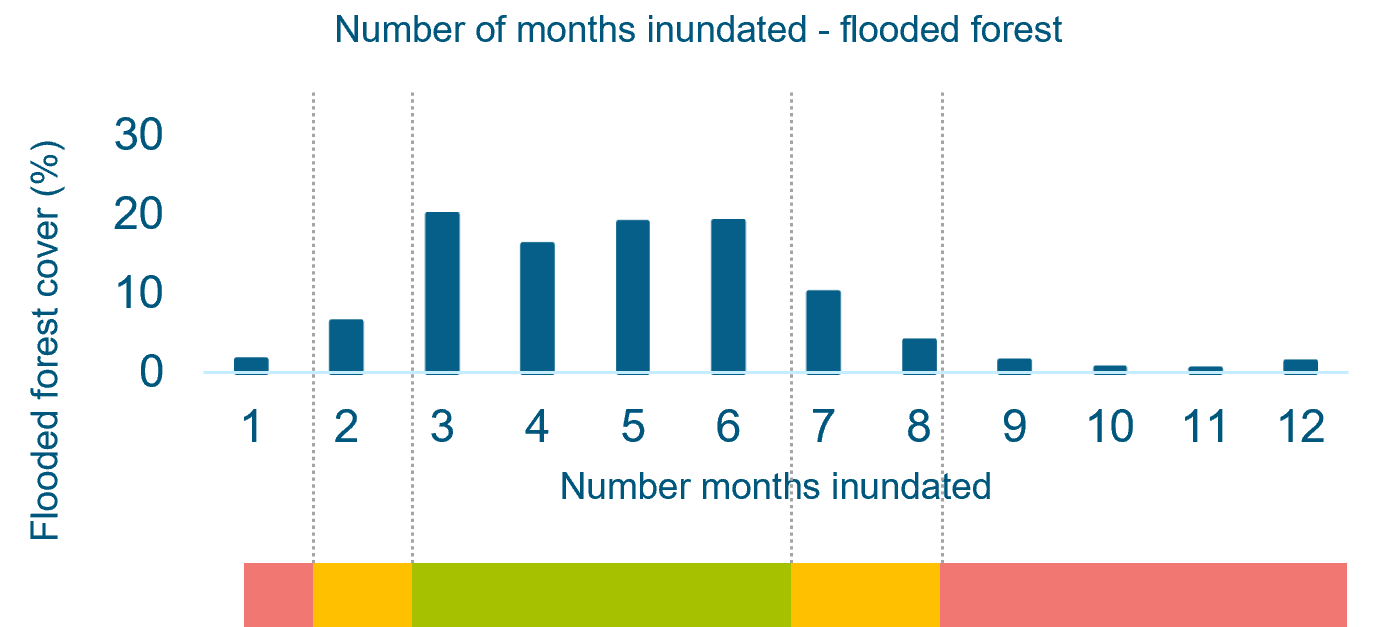
We combined the flooded forest land cover and a dataset that shows the average months of yearly inundation to analyse in which inundation conditions flooded forest thrives in Cambodia. The findings are presented in the figure below, illustrating the percentage of flooded forest coverage across different durations of inundation in months. This analysis has resulted in the following classification:
-
i [Green] - Highly suitable: 3 to 6 months of inundation
-
ii [Orange] - Moderately suitable : 2,7 or 8 months of inundation
-
iii [Red] - Not suitable: 0,1 or more that 8 months of inundation
Suitability factors classification, score and sources
Suitability factor classification scheme
The table below describes the classification scheme used per suitability factors.
No. | Component | Code | Classification |
1 | Land use (L) | L1 | Flooded forest and related land covers types |
L2 | All others | ||
2 | Soil characteristics (G) | G1 | Optimal: Gleysol |
G2 | Acrisol, Fluvisol, Cambisal, Plinthosol | ||
G3 | all others | ||
3 | Forest Landscape integrity (F) | F1 | Low forest integrity score (<5) |
F2 | Moderate integrity score 5-8 | ||
F3 | High integrity score >8 | ||
4 | N months inundated (S) | S1 | 3 – 6 months |
S2 | 2,7 or 8 months | ||
S3 | 1 month or more than 8 months |
Suitability factor scoring scheme
The table below describes the scoring used per suitability factor.
Suitability component | Highly Suitable (Score = 2) | Moderately Suitable (Score = 1) | Not suitable (Score = 0) |
Land use (L) | L1 | L2 | |
Soil (G) | G1 | G2 | G3 |
Forest Landscape integrity (F) | F1 | F2 | F3 |
Seasonally inundated area (S) | S1 | S2 | S3 |
Suitability factor sources
The table below describes the data source per suitability factor.
No. | Data type | Data source | Data description | Data type |
1 | Land use | MRC project: Land use cover | Land use cover | Raster (15x15m) |
2 | Soil map | MRC project: Soil map | Soil types | Polygon |
3 | Forest Landscape integrity | Grantham, H. S. et al. (2020). Anthropogenic modification of forests means only 40% of remaining forests have high ecosystem integrity. Nature communications, 11(1), 1-10. | four data sets were combined representing: (i) forest extent; (ii) ‘observed’ pressure from high impact, localized human activities for which spatial datasets exist, specifically: infrastructure, agriculture, and recent deforestation; (iii) ‘inferred’ pressure associated with edge effects, and other diffuse processes, (e.g. activities such as hunting and selective logging) modelled using proximity to observed pressures; and iv) anthropogenic changes in forest connectivity due to forest loss. These datasets were combined to produce an index score for each forest pixel (300m), with the highest scores reflecting the highest forest integrity, and applied to forest extent for the start of 2019. | Raster 300x300 m |
3 | Seasonally inundated area | Pekel, JF., Cottam, A., Gorelick, N. et al. High-resolution mapping of global surface water and its long-term changes. Nature 540, 418–422 (2016). https://doi.org/10.1038/nature20584 | The Water Seasonality product provides information concerning the intra-annual behaviour of water surfaces. It separates 'permanent' water bodies (those that are present throughout the period of observation) [nominally a year] from 'seasonal' (those that are present for only part of the year); the degree of seasonality is also represented (i.e. the proportion of the total number of observed months in which water is present). | Raster (30x30m) |
4 | Water occurrence change | Pekel, JF., Cottam, A., Gorelick, N. et al. High-resolution mapping of global surface water and its long-term changes. Nature 540, 418–422 (2016). https://doi.org/10.1038/nature20584 | The Water Occurrence Change Intensity product shows where surface water occurrence increased, decreased or remained invariant between 1984 and 2021. Both the direction of change (i.e. increase, decrease or no change) and its intensity are documented. | Raster (30x30 m) |